UK energy use and generation
UK energy use and generation
14/01/21
What you can do: –
- Lobby MPs and government to commit to five yearly energy use and GHG emission targets within the 2021 -2050 period to ensure action starts now
- Reduce your own carbon footprint by reducing energy use in the home and by making life style changes
- Invest in community and commercial renewable energy schemes
- Only install renewable energy schemes yourself if they are as efficient as investing in larger schemes
UK energy use
In 2017, the UK consumed 192.1 million tonnes oil equivalent (Mtoe) of fossil fuels (Table 1). Approximately 40 Mtoe of this total was used to generate electricity.
The fossil fuel not used for generating electricity, 152.0 Mtoe, was consumed as fuel; natural gas, oil and coal, used in homes, industry, transport, shipping and aviation.
With most of the spotlight being put on decarbonising electricity production, we often forget we must significantly reduce energy used as fuels. For mobile applications like shipping and flying, this will not be easy.
UK energy use and carbon dioxide emissions
The essential change we need to make is to reduce our green house gas emissions, of which carbon dioxide is the main component (See Table 1).
Table 1 UK Fossil fuel consumption and GHG emissions
| Carbon fuel used and emissions | Data | Government target | |||
| Year | 1990 | 2000 | 2010 | 2017 | 2050 |
| Fossil fuels use (Mtoe) | 213.6 | 234.8 | 219.5 | 192.1 | |
| Carbon dioxide emissions (Mt CO2 eq) |
594 | 554 | 493 | 367 | 0 |
| Greenhouse gas emissions (Mt CO2 eq) |
794 | 705 | 597 | 456 | 0 |
Source BEIS, UK energy in brief. 2018
Greenhouse gas emissions reduced from 794 Mt CO2 equivalent in 1990, to 456 Mt CO2 eq in 2017. This shows that by 2016 we had already reduced output to below the 519 Mt CO2eq (35% reduction of 1990 figures) required by the UK Climate Change Act, 2008. However, this reduction was primarily achieved by changing from coal to natural gas to generate electricity. Gas produces significantly less CO2 than coal per kWh of energy produced.
Greenhouse gasses include CO2 , methane (CH4) and nitrogen oxides (NOx) . In 1990, the CH4 and NOx made up 794-594 = 200 Mt CO2 eq GHG emissions. CH4 and NOx production reduced to 98 Mt CO2 eq in 2017, mainly due to reduced landfilling of waste and landfill gas collection systems.
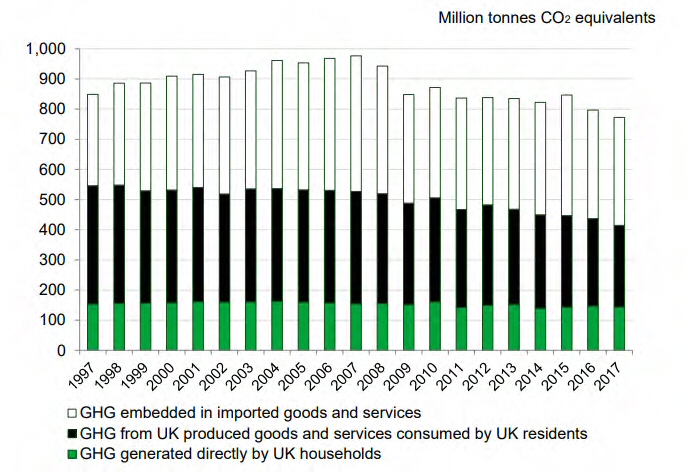
The movement of heavy, energy-hungry, industries such as steel making overseas also reduced UK CO2 emissions. Carbon dioxide emissions produced in the manufacture of these goods, termed embedded or consumption emissions, are shown in Figure 1. These emissions should be included in the overall UK emissions, but politicians tend to ignore this as it spoils the UK’s decarbonisation record. Since countries that export to us are also decarbonising, these imports should decrease their embedded carbon over time.
Now that coal is little used, and gas is the main fossil fuel used to make electricity, reducing greenhouse gas output to zero by 2050 means radical changes and real action will be needed.

Figure 1. UK GHG emissions from home and imported goods and services
Fossil fuel used for air travel
Air travel saw the greatest percentage increase in carbon footprint between 1990 and 2016 – up 245%, from 19 to 47 million tonnes of carbon dioxide equivalent (MtCO2 eq). At present these carbon dioxide emissions are monitored by airlines as part of a UN aviation scheme which aims to ensure any rise in aviation is offset elsewhere. International aviation does not form part of UK net-zero targets under the Climate Change Act. This means the UK government has not formally recognised that we need to take responsibility for our aviation footprint (WWF, 2020).
Proportion of fossil fuel used to generate electricity
Table 2 shows how fossil fuel generated electricity in 2016 is at last starting to reduce and to be replaced by renewables. Fossil fuels still constitute 36% of the energy mix. Renewables in 2019 now provide 48% while nuclear provides 14%.
Table 2 UK Electricity consumption and source (a)
| UK energy generation | Data | |||||
| Year | 1990 | 2000 | 2005 | 2010 | 2015 | 2019 |
| Fossil fuel used to generate electricity (Mtoe) |
54.2 |
60.7 |
65.0 |
60.2 |
41.0 |
30.0 |
| Electricity (TWh) from:- | ||||||
| Fossil fuels | 233.0 | 274.6 | 292.6 | 288.0 | 177.8 | 139.9 |
| Nuclear | 58.7 | 85.0 | 81.6 | 62.1 | 70.3 | 56.2 |
| Renewables | 5.2 | 10.4 | 17.5 | 36.5 | 123.6 | 184.9 |
| Other fuels + pump storage | 5.9 | 7.10 | 6.6 | 5.7 | 7.4 | 8.12 |
| Total | 302.8 | 377.0 | 398.4 | 392.4 | 379.1 | 389.1 |
(a) Energy trends: UK electricity-Gov.UK, 2020
There is evidence that homes in the UK are using 10% less energy in 2016 than in 2004, but this seems to be technology based (e.g. condensing boilers, more efficient white goods, and LED lighting). We are not making our homes more efficient, flying less or buying small, more efficient conventional or electric cars. The commitment to reduce our CO2 output to zero by 2050 is a big ask, and can only be achieved by joint endeavour of government, industry, and the UK population. Relying on our politicians endlessly discussing agreements like the Paris accord in 2016, while effectively sitting on our hands, must stop.
The one successful development to date is the increase in renewables for electricity generation.
Nuclear power
Nuclear power at present provides 14 % of the electricity used in the UK. It provides a continuous supply to the grid, called base load, as nuclear power stations take longer than gas generating plants to start up and shut down. While an increasing amount of nuclear generation capacity would seem a natural partner to renewable energy, this is not the case (Barnham,2014). If the government decides to increase nuclear capacity, it will vie with renewable energy. Despite it costing the National Grid plc more than renewable energy, in periods when there is surplus generation, nuclear power will probably be kept going while renewables will be switched off.
Community renewable schemes
While the bulk of renewable energy production is being built by commerce, community groups are also involved. As with almost all activities, economies of scale reduce the unit cost of production. It therefore makes economic sense for individuals to club together to install large wind or solar power sites rather than to act alone and build micro generators for their own homes. Two examples of community schemes are described below.
- Udny, Aberdeenshire, community wind farm
The Udny community came together to set up the Udny Community Wind Farm, with the intention of erecting their own wind turbine. After a great deal of work, the 800 kW Enercon wind turbine was commissioned in May 2011, with a loan from Tridos bank. The company gets Feed-In Tariffs (FITs) for the electricity it produces. The money earned is made available annually for funding local initiatives in the community.
Subsidies in the form of FITs were introduced by government in 2008 to encourage companies and householders to install renewable generation schemes. The FITs are guaranteed for 20 plus years and help make the investment more viable. This “pump priming” has been hugely successful, perhaps too successful, so is unlikely to be available in future.
Mackie’s turbines
While it has not been possible to get the capital costs and energy generated from the Udny site, this information is available from the three nearby turbines, Margaret, Matilda and Mirabel, on Westerton Farm, Daviot, Rothienorman, owned by Mackie’s of Scotland (Table 3). The figures presented assume there were no subsidies, so represent the situation once current FITs have all gone.
Table 3. Costs and income from three 850 kW turbines erected in 2011, assuming all the energy generated is sold to the grid for 7.5 p per kWh (£75 per MWh).
| Costs | Income | |||
| Capital cost | £3,600,000 | |||
| Annual costs | Site rent | £40,000 | Electricity generated (kWh) | 7,352,185 |
| Maintenance | £40,000 | |||
| Interest (at 6%) | £216,000 | |||
| Insurance | £10,000 | |||
| Depreciation (15 yrs) | £240,000 | |||
| Total | £546,000 | Income at 7.5p/kWh | £551,414 | |
Source:- Maitland Mackie, (2011). The real rational for renewable energy. pp 25. www.greenergynet.com/scotlands-energy-challenge
The figures above show that wind energy from this site is viable at a selling price of 7.5 p (or above) per kWh (Strike price of £75/MWh).
The site rent could be seen as an additional income as little grazing land is lost to the turbines.
2. Aberdeen Community Energy (ACE) – Donside Hydro Scheme.

In 2015 Donside Community Association (DCA) formed ACE to develop a hydro power scheme in the lower reaches of the River Don in Aberdeen. The adjacent Sanctuary (social landlord) housing development had been going to build a hydro generation plant on the River Don, but decided against this. The DCA were disappointed to see such a worthwhile environmental project being scrapped, so decided to develop the scheme themselves, under the title ACE. The site chosen was at a bend in the river which has a 2m drop (head). It is the same location where Donside Papermill many years ago extracted water from the river to feed its own generators.
ACE appointed Highland Eco-design Ltd, a Scottish hydro power development company, to design and build the plant. The company offered to underwrite the scheme finance until such a time as the community could raise the funds through crowdfunded investments. An initial £500,000 of shares at a target 7% annual return, was raised by mid-August 2016, with the offer being fully subscribed within three weeks. A further £600,000 bond offer, at 4% annual return, was then offered to investors from near and far. The plant has a capacity of 100 kW and produces enough power for an average of 130 homes. It runs almost constantly, except when the river is too low in mid-summer and when shut for technical or maintenance reasons. The community has since received additional funding to design a parkland setting for the Donside Hydro, including landscaping, tree planting and better publicity boards. (The author has a £5,000 bond at the 4% return).
Strike prices for types of power
National Grid UK makes deals with smaller generators on a day to day basis. For large scale future developments like nuclear power stations and large windfarms, they may agree a strike price for a 20-30 year period with the company planning to build and run the plant. This gives the company greater certainty that their plant will provide a return on their investment. The strike price for various types of generating plant (Table 3) gives an idea as to which energy production systems are the cheapest.
Table 3 Strike prices for renewables, nuclear and gas generating plant. (£/MWh)
| Energy source
Year |
2018 |
2020 |
2022 |
| Nuclear | – | 93 | 93 |
| Offshore Wind | 120 | 101 | 75 |
| Onshore wind | 65 | 63 | 46 |
| PV-Solar | 75 | 67 | 64 |
| Gas | 61 | 66 | 72 |
What is noticeable from Table 3 is how quickly renewable energy is falling in price. Land-based wind generated power being the lowest cost system with solar-pv not far behind. Wind dominates in winter while solar dominates in summer, a perfect match.
Future developments to decarbonize UK energy production
One aim for National Grid plc is to decarbonise electricity production, while minimising the cost of energy to us, their consumers. With the rapidly falling cost of renewables compared with nuclear, this will make renewable companies the preferred power producers. The grid will be used to source electricity when renewables nearby are not available. This may be from renewable energy generators elsewhere in the UK or abroad, or gas fueled power stations. As transmitting electricity long distance results in high transmission power losses, battery storage may also be used to supply power to fill gaps in production. Ellon Musk, of Tesla Cars, California, is actively working on large scale battery installations.

Electricity from the grid will increasingly be used to charge the batteries of electric cars, thereby reducing the use of fossil fuels for transport. These self-same batteries may be able to back up the grid when necessary, when renewables are absent.
In the longer term, we will have to stop using natural gas for heating our homes. Reduced demand for gas can be achieved with better sealed houses and better insulation. When gas is needed, we may use biogas from anaerobic digestion (AD) plants, injected into the gas network. These plants are increasingly being seen on farms, with their familiar domes showing above the trees. The alternative is to use heat pumps to warm our houses. These use electricity to transfer heat from an underground network of pipes, or air source heat exchangers, to underfloor heating in the house.
Where peaks in energy from renewables cannot be utilised on a regular basis, the spare electricity can be used to make hydrogen and ammonia, the former as a fuel for tractors, planes and shipping, the latter for making into nitrogen fertiliser.
For all these developments the grid is key and electricity provides a route to fossil fuel free energy. The self-contained small farm or croft with its own energy supply is not the future.
To appreciate the scale of the change, visit “Sustainable energy- without the hot air” by Prof David MacKay. One can play around with various scenarios in his model, but those objecting to the present wind farms will have to get used to many more.
