
Graph of annual energy use
3-02-21
Monitoring annual building energy use
In community buildings, or even in your own home, it is good to keep a log of annual energy use. If people see the bars of a graph reducing in height over time they will try to modify their behavior to use less energy. The spread sheet GraphEnergyUse-2016 has been set up to make this easy to do. All you need to do is click on to the link, download the spreadsheet to your own computer, then fill in the necessary data. 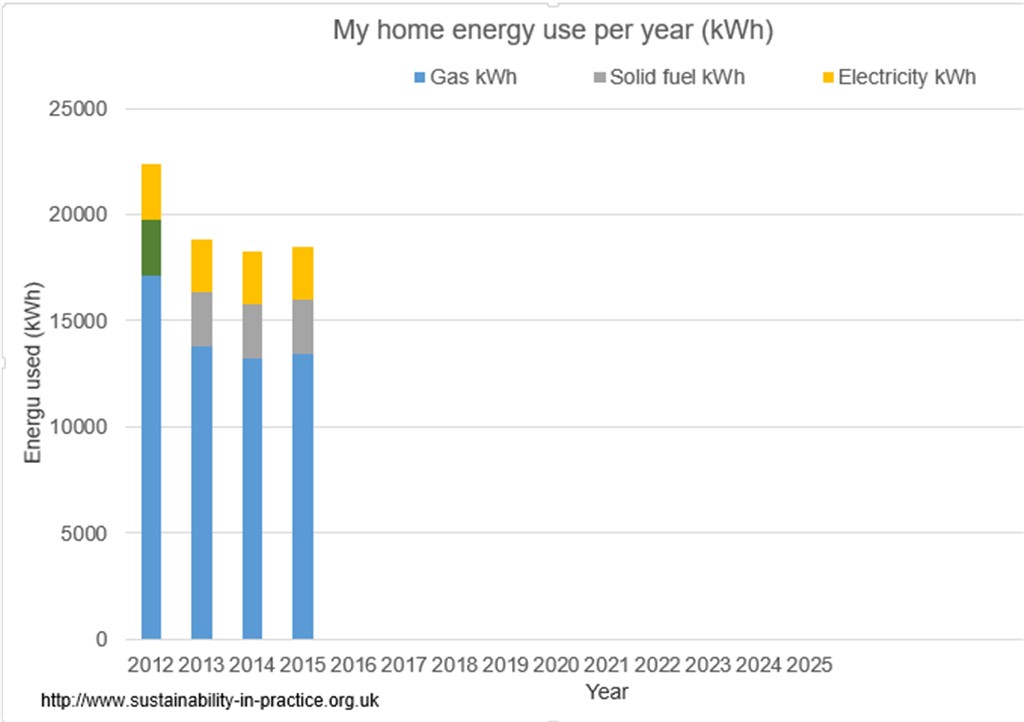
The spread sheet consists or a sheet with information and calculations along with an accompanying graph. The sheet is protected, but with boxes to allow you to input your own data. All the items in blue text can be altered. If you don’t use some of the fuels listed, go to the graph, highlight the graph legend showing the fuels used and delete these unused. Once you have input your own data and produced the graph, print it out and display it on a notice board for others to see. This will show others your annual energy use year on year, which, as a building’s energy efficiency is improved, should show diminishing energy used over time.If you are competent with Excel, you can unprotect the graph and modify it to suite your particular needs. If you get into trouble with doing this, simply download a new sheet from the website and try again.